Event-B Classdiagrams
this page is under construction
Introduction
In iUML-B, Class diagrams are used to define and visualize entity-relationship data models. They can be added to Event-B Machines and Event-B Contexts and visualize given sets , constants and variables. Diagram elements elaborate pre-existing user data in order to visualize it. The diagram defines type, sub-type and further constraint information for the data by generating invariants or axioms.
Principles of Operation
Classes, Attributes and Associations are all model elements that represent data. They can be linked to existing Event-B data elements: Variables, Constants or (for Classes only) Carrier Sets. This relationship is called Elaborates because the diagram element elaborates properties of the data item.
Any data element within scope, locally within the same machine or context, or via sees and extends, can be elaborated. As a short cut, a button is provided to create a new data item and link to it in one step.
Class diagrams can be added to Machines or Contexts, but note that some features are not available when in a Context (e.g. only constants and sets are within scope to link to and methods cannot be used in classes).
Methods can be placed inside Classes and link (elaborate) one or more events in the containing Machine. This means that the elaborated events are given a paramter representing the class instance (similar to 'this' or 'self' in programming languages). When in variable classes (i.e. a class that elaborates a variable) methods may be constructors or destructors.
Main Data Elements of a Class Diagram
The main data elements of a class diagram are class, association and attribute. These elements all visualize an Event-B data item (set constant or variable) in the Event-B model. Only a class can visualize a set. The class diagram also visualizes the type and subtype of the data item as follows.
Class
A Class visualizes a data item that is a set or subset. a) If the class diagram is in a Context and the class has no generalization relationships, and its
Association
Atttribute
Elaboration and Generation
tbd
Scope
Elements of the class diagram can define data in the containing Event-B component and can visualize data in any Event-B component that is visible to the containing Event-B component (including itself). Hence a class diagram in a context may define/visualize sets and constants in the containing context and visualize sets and constants in any context which is extended (closure) by the containing context. A class diagram in a machine may define/visualize variables in the containing machine, visualize variables in any machine it refines (closure) and visualize sets and constants in any context that is seen by the machine or any Context that is extended by a context that is seen by the machine.
Secondary information
Colour is used to indicate whether a diagram element has been linked to data. Icons are used to indicate the kind (set, constant or variable) of elaborated data.
Example
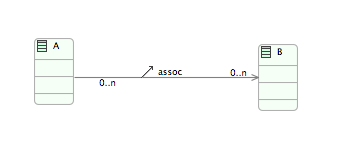
For example when a class diagram is first drawn and has not been linked to data it looks like this:
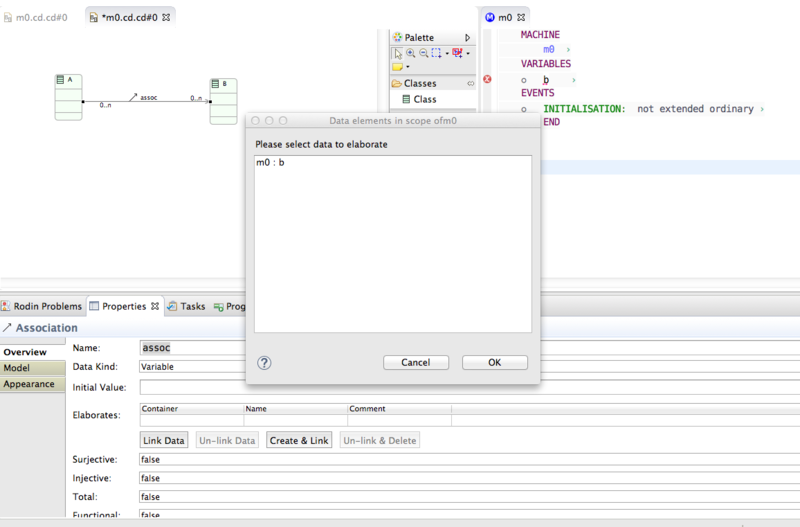
Generating this diagram produces no output to the Event-B. The diagram elements must first be linked to data using the Link Data or Create & Link buttons in the properties sheet. The followng screenshot shows the association being linked to a variable b that already exists in the machine.
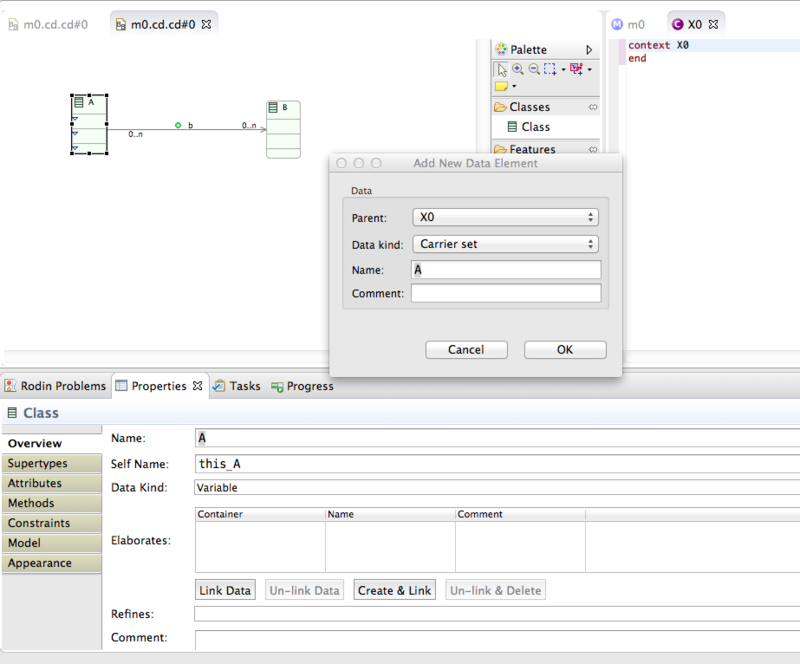
The following screenshot shows the class A being used to create and link to a carrier set in the seen context X0. Note that the carrier set is created in X0 immediately. It is not necessary to generate.
Class Diagrams in Contexts
subtype


